GeoJSON으로 대한민국 시군구읍면동 맵차트 그리기
최근에 진행하고 있는 사이드 프로젝트 중 하나에 전국/시/군/구/읍/면/동 별 맵차트를 그려야 할일이 생겼었다.
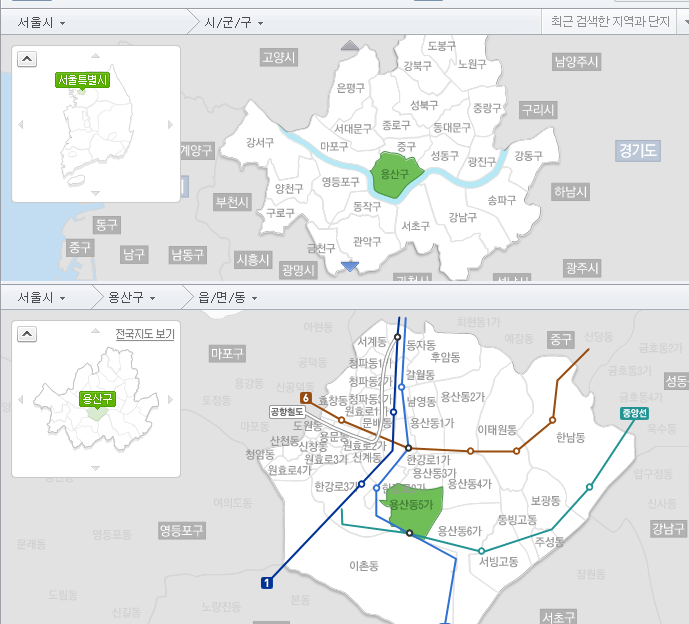
특정 지역의 분포도라던지 히트맵 정도를 지도에 보여줘야 하는 요구사항이었는데(네이버 부동산처럼)
그간 GIS쪽이나 이런쪽은 SI사업을 주로 하다보니 솔루션 베이스로 다뤄봤지만 직접 구현해본적은 없어서 이리저리 자료 조사를 해보니 그럭저럭 오픈소스를 활용해서도 원했던 요구사항 정도는 충분히 커버 할 것 같아서 진행해보았다.
언제나처럼 뭐 이런저런 삽질은 했지만 작업하고 나니 꽤나 간단하게 구현이 가능하다.
준비물
시/군/구/읍/면/동 별 맵 차트를 그리기 위해 가장 중요한건 사실 지도 데이터이다.
우선 원천데이터는 SHP File(Shape file 이하 SHP)이 필요하다.
SHP 포맷은 GIS(지리정보시스템) 에서 가장 유명한 지리정보를 표현하기 위한 벡터 데이터 포맷이다.
ESRI라는 곳에서 개발되었고 최근엔 거의 GIS 소프트위에 제품쪽에서는 de facto로 광범위하게 사용되고 있는 것 같다.
매우 고맙게도 아래 블로그나 포털에서 다운로드 받을 수 있다.
특히나 공간정보시스템 연구소에서 제공해주는 SHP 파일은 꽤나 유용해서 해당 파일로 작업을 진행했다.
(시간과 노력이 분명 들어가는 일일텐데 매번 업데이트도 마다하지 않고 매우 감사하다)
웹에서 어떻게 표현하지?
브라우저에서 SHP 파일을 직접 핸들링하기에는 힘들고 맵을 표현하기 위해서는 GeoJSON이라는 지리 정보 표시를 위한 표준 Json포맷으로 변환해야 한다.
GeoJSON의 포맷은 다양한 지리 데이터 구조를 인코딩하고 표현하기 위한 형식으로 RFC 표준(RFC 7946)으로 정해져 있고 해당 형식으로 변환을 하면 된다.
SHP to GeoJSON에는 여러가지 방법들이 있겠지만 나는 GDAL이라는 지리데이터 변환 라이브러리에서 제공하는 ogr2ogr 이라는 tool을 사용했다.
변환에 앞서 최적화가 필요하다
앞서 얘기했듯이 SHP에 표현되는 벡터 정보는 폴리곤들이 꽤 디테일하게 그려져 있기 때문에 사이즈가 크기도 하고 좀더 심플하게 표현할 필요가 있다.
여러가지 변환툴을 찾다보니 Mapshaper라는 SHP 에디팅 툴을 많이 사용하는 것 같고 javascript로 만들어져 있기 때문에 node.js만 설치하면 쉽게 사용할 수 있고 GUI 툴도 같이 제공해준다.
Simplify 작업을 수행하기 전에 node.js가 먼저 설치되어 있어야 한다.
# mapshaper 설치
$ npm install -g mapshaper
이제 Mapshaper CLI를 사용할 수 있고 공간정보시스템 연구소에서 제공하는 시군구 SHP 파일을 Simplify해보자
$ mapshaper -i TL_SCCO_SIG.shp \
            encoding=euc-kr  \
            -simplify weighted 0.5% \
            -o format=shapefile \
            TL_SCCO_SIG_convert.shp

hkwon@DESKTOP-HDB86IE:/mnt/c/Temp/map/SIG_201703$ ls -al
합계 11551133
drwxrwxrwx 0 root root      512  8월 22 09:05 .
drwxrwxrwx 0 root root      512  8월 22 08:50 ..
-rwxrwxrwx 1 root root    21629  5월  3 12:37 TL_SCCO_SIG.dbf
-rwxrwxrwx 1 root root      406  1월 15  2014 TL_SCCO_SIG.prj
-rwxrwxrwx 1 root root 21438444  5월  3 12:37 TL_SCCO_SIG.shp
-rwxrwxrwx 1 root root     2100  5월  3 12:37 TL_SCCO_SIG.shx
-rwxrwxrwx 1 root root    21629  8월 22 09:05 TL_SCCO_SIG_convert.dbf
-rwxrwxrwx 1 root root      406  8월 22 09:05 TL_SCCO_SIG_convert.prj
-rwxrwxrwx 1 root root  1597344  8월 22 09:05 TL_SCCO_SIG_convert.shp
-rwxrwxrwx 1 root root     2100  8월 22 09:05 TL_SCCO_SIG_convert.shx
변환된 결과를 Mapshaper GUI에서 확인해 보면
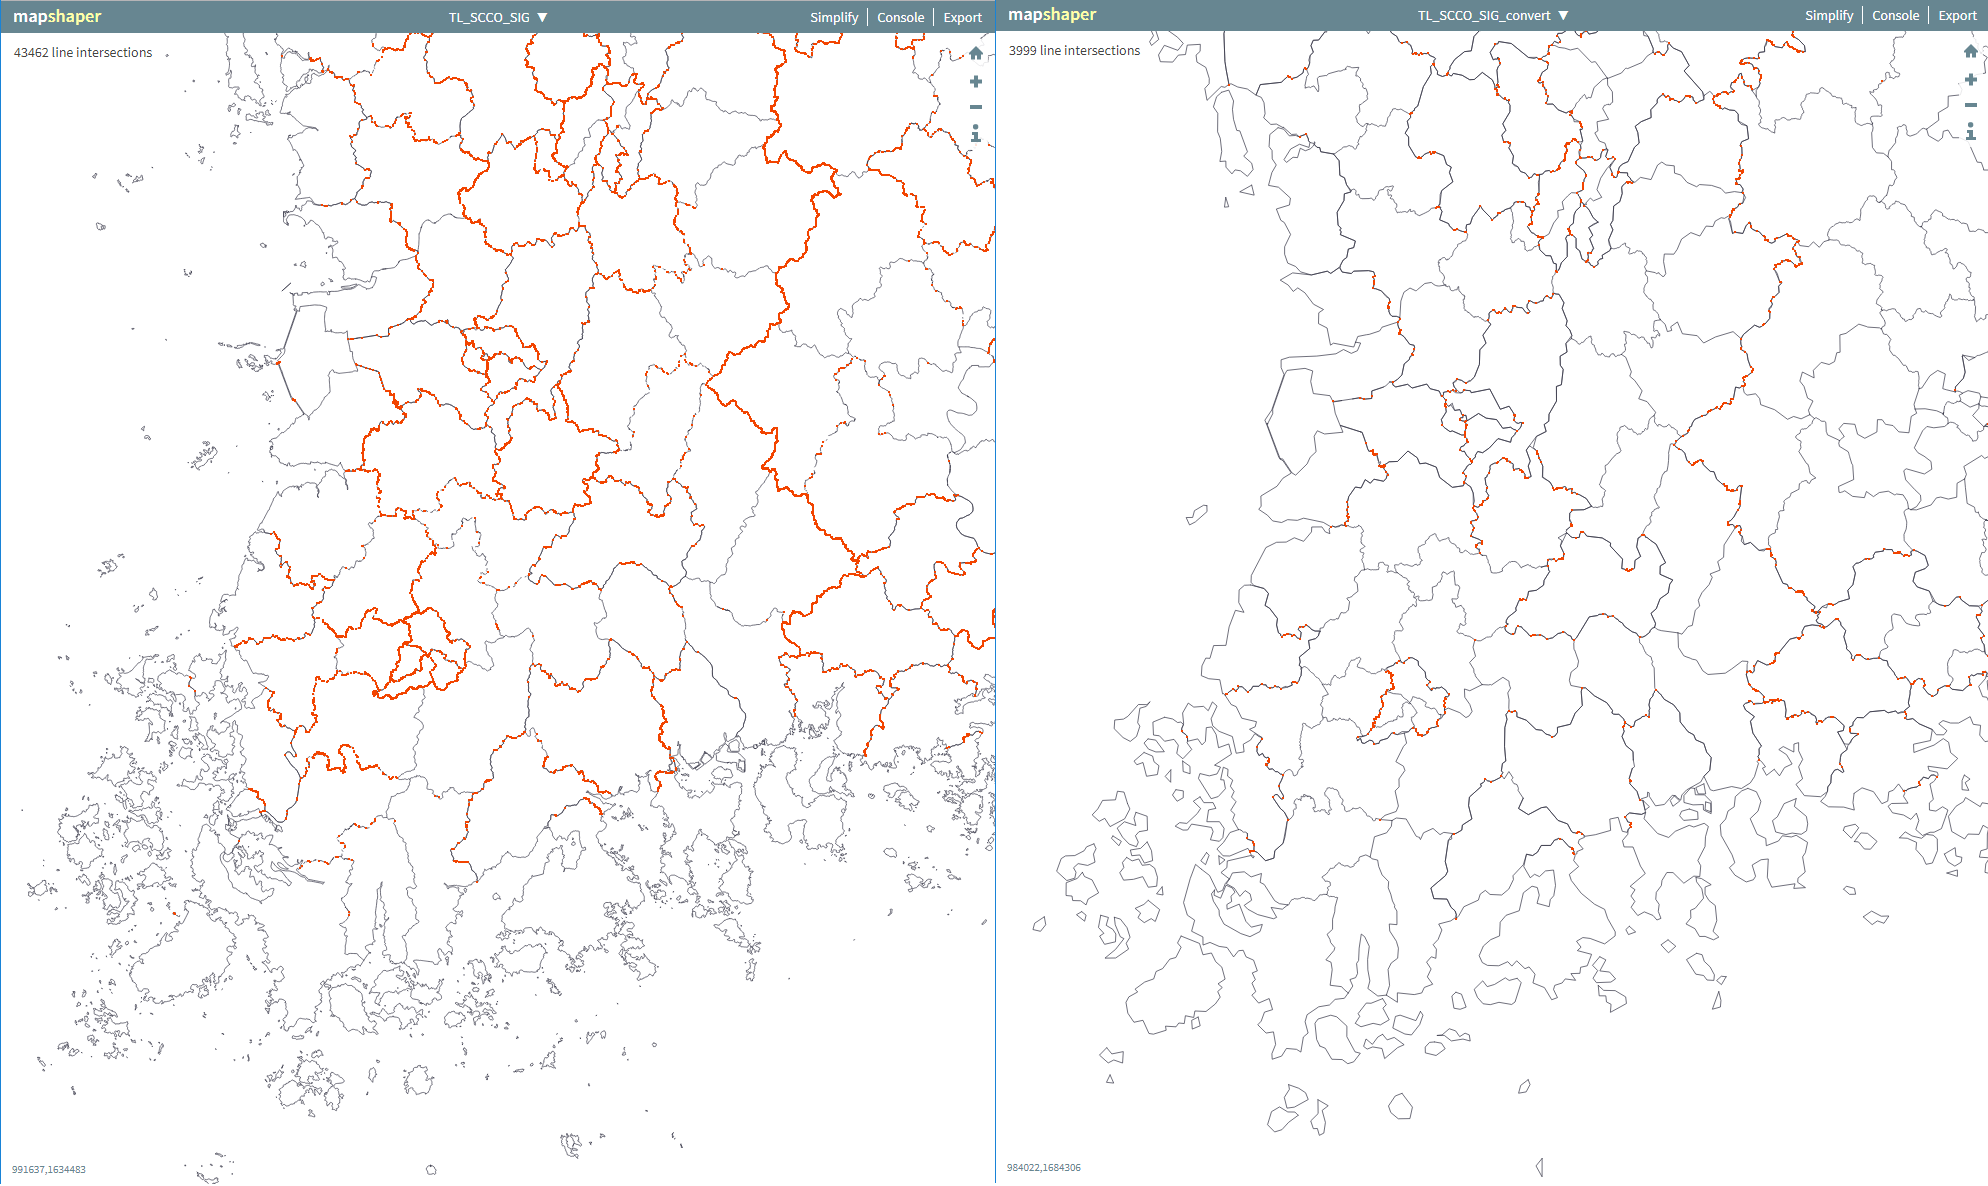
사이즈가 21M에서 1.5M 정도로 줄어들고 디테일하던 섬들 line이 간결화된걸 볼 수 있다. 더 다양한 변환 옵션은 해당 라이브러리 github에서 찾아보면 되고 개인적인 기준에서는 0.5% 정도가 제일 적당하게 단순화 되는 것 같다.
GeoJSON 으로 변환
SHP 파일이 준비 됐으니 이제 GeoJSON으로 변환을 하면 데이터 준비는 완료된다.
앞서 얘기했듯이 SHP to GeoJSON은 GDAL 패키지의 ogr2ogr를 사용해서 변환할 수 있다.
윈도우나 리눅스 머신 둘다 설치 패키지는 제공해주고 있으니 상황에 맞게 GDAL 패키지를 설치한다.
# ubuntu에서 설치
$ sudo add-apt-repository ppa:ubuntugis/ppa && sudo apt-get update
$ sudo apt-get install gdal-bin
이제 ogr2ogr을 사용할 준비가 됐고 기본 옵션은 아래와 같다.
$ ogr2ogr
Usage: ogr2ogr [--help-general] [-skipfailures] [-append] [-update]
               [-select field_list] [-where restricted_where|@filename]
               [-progress] [-sql <sql statement>|@filename] [-dialect dialect]
               [-preserve_fid] [-fid FID]
               [-spat xmin ymin xmax ymax] [-spat_srs srs_def] [-geomfield field]
               [-a_srs srs_def] [-t_srs srs_def] [-s_srs srs_def]
               [-f format_name] [-overwrite] [[-dsco NAME=VALUE] ...]
               dst_datasource_name src_datasource_name
               [-lco NAME=VALUE] [-nln name]
               [-nlt type|PROMOTE_TO_MULTI|CONVERT_TO_LINEAR]
               [-dim 2|3|layer_dim] [layer [layer ...]]
.....
Note: ogr2ogr --long-usage for full help.
사용할 옵션중 COORDINATE_PRECISION은 좌표 표현값이 너무 커서 정밀한 작업은 하지 않을 것이기 때문에 소수점 3자리로 줄여서 변환하는 옵션을 줬다. 물론 그만큼 GeoJSON의 사이즈도 작아진다.
아래의 명령어로 변환이 가능하다.
$ ogr2ogr -f GeoJSON -lco COORDINATE_PRECISION=3 \
          "sig.json" \
          "TL_SCCO_SIG_convert"
전국 맵은 시도 SHP 파일로 쉽게 변환할 수 있고 시군구, 읍면동은 전체가 이어진 하나의 맵으로 되어 있으니 요놈을 시군구, 읍면동 별로 잘라내서 저장해야 서울특별시.json, 서울특별시_강남구.json 과 같은 분리된 파일을 얻을 수 있다.
다행히 국가공간정보포털에서 제공해주는 파일에는 행정구역코드가 함께 포함되어 있어 쉽게 구분해 낼 수 있을 것으로 보였고 간단하게 gulp 태스크를 만들어 변환작업을 연결시켰다.
행정구역코드에 관련된 내용은 [통계청>통계분류포털>특수/일반/국제/행정구역분류>행정구역분류>자료실] 을 참조하면 된다.
var fs = require("fs");

var gulp  = require('gulp'),
    gutil = require('gulp-util'),
    clean = require('gulp-clean'),
    exec  = require('child_process').exec,
    _     = require('lodash'),
    iconv = require('iconv-lite');

var shpPath = {
    ctprvn : {
        source : 'src/CTPRVN_201703/TL_SCCO_CTPRVN.shp',
        convert : 'src/CTPRVN_201703/TL_SCCO_CTPRVN_CONVERT.shp',
        json : 'dist/ctprvn.json'
    },
    sig : {
        source : 'src/SIG_201703/TL_SCCO_SIG.shp',
        convert : 'src/SIG_201703/TL_SCCO_SIG_CONVERT.shp',
        json : 'dist/sig.json'
    },
    emd : {
        source : 'src/EMD_201703/TL_SCCO_EMD.shp',
        convert : 'src/EMD_201703/TL_SCCO_EMD_CONVERT.shp',
        json : 'dist/emd.json'
    }
}

gulp.task('default', ['convert']);

gulp.task('clean-shp', function() {
    return gulp.src(['dist/*.json', 'src/**/*_CONVERT.*'])
        .pipe(clean());
});

gulp.task('clean-split', function() {
    if (!fs.existsSync('dist/sig')){
        fs.mkdirSync('dist/sig');
    }

    if (!fs.existsSync('dist/emd')){
        fs.mkdirSync('dist/emd');
    }

    return gulp.src(['dist/sig/*.json', 'dist/emd/*.json'])
        .pipe(clean());
});

gulp.task('convert', ['clean-shp'], function() {
    for (var key in shpPath) {
        console.log('==========');

        mapshaper(key, shpPath[key].source);
    }
});

gulp.task('split', ['clean-split'], function() {
    // 시군구 geojson 생성
    splitGeojson('sig');

    // 동 geojson 생성
    splitGeojson('emd');
});

function mapshaper(key) {
    var command = 'mapshaper -i '
                + shpPath[key].source
                + ' encoding=euc-kr -simplify weighted 0.5% -o format=shapefile '
                + shpPath[key].convert;

    console.log(command);

    exec(command, function (error, stdout, stderr) {
        if (error) {
            console.error(`exec error: ${error}`);
            return;
        }

        console.log(stdout);
        console.log(stderr);

        console.log('=> convert size')
        console.log('%s : %d bytes', shpPath[key].source,  fs.statSync(shpPath[key].source).size);
        console.log('%s : %d bytes', shpPath[key].convert, fs.statSync(shpPath[key].convert).size);
        console.log('=>')

        ogr2ogr(key);
    });
}

function ogr2ogr(key) {
    var command = 'ogr2ogr -f GeoJSON -lco COORDINATE_PRECISION=3 "'
                + shpPath[key].json
                +'" "' + shpPath[key].convert + '"';

    console.log(command);

    exec(command, function (error, stdout, stderr) {
        if (error) {
            console.error(`exec error: ${error}`);
            return;
        }

        console.log(stdout);
        console.log(stderr);

        console.log('=> convert json size')
        console.log('%s : %d bytes', shpPath[key].json, fs.statSync(shpPath[key].json).size);
        console.log('=>')
    });
}

function splitGeojson(type) {
    console.log("\n *Split geoJSON START* \n");
    console.log(type);

    var fileName = shpPath[type].json;
    //var exception = [ "47940" ];
    var exception = [];

    // 시군구 데이터 sido 별로 자르기
    var contents = fs.readFileSync(fileName);
    var features ={};
    contents = iconv.decode(contents, 'utf-8');

    var jsonContent = JSON.parse(contents);

    for (var key in jsonContent.features) {
        var feature = jsonContent.features[key];
        var subKey, cd, name;

        if (type == 'sig') {
            cd = feature.properties.SIG_CD;
            name = feature.properties.SIG_KOR_NM;
            subKey = feature.properties.SIG_CD.substr(0, 2);
        } else if (type == 'emd') {
            cd = feature.properties.EMD_CD;
            name = feature.properties.EMD_KOR_NM;
            subKey = feature.properties.EMD_CD.substr(0, 5);
        }

        console.log(`feature.properties.cd: ${cd}, feature.properties.name: ${name}`);

        if (features.hasOwnProperty(subKey)) {
            if (!_.has(exception, cd)) {
                features[subKey].push(feature);
            }
        } else {
            features[subKey] = [];

            if (!_.has(exception, cd)) {
                features[subKey].push(feature);
            }
        }
    }

    for (var key in features) {
        var featuresCollection = _.template('{"type": "FeatureCollection", "features": [ \
                <% _.forEach(iterator, function(val, index, list) { %> \
                \n  <%= JSON.stringify(val) %><% \
                if (index < list.length - 1) { \
                %>, <% \
                } \
                }); %> \
            \n]}');

        var jsonStr = featuresCollection({
            'iterator': features[key]
        });

        // split json파일 생성
        fs.writeFileSync("dist/" + type + "/" + key + ".json", jsonStr);
    }

    console.log("\n *EXIT* \n");
}
사용했던 라이브러리는 참조 바란다.
  "devDependencies": {
    "gulp": "^3.9.1",
    "gulp-clean": "^0.3.2",
    "gulp-exec": "^2.1.3",
    "gulp-util": "^3.0.8",
    "iconv-lite": "^0.4.17",
    "lodash": "^4.17.4"
  }
행정구역 코드 별로 파일을 다 분리해내면 이제 원하는 맵을 그릴 준비가 된다.
# 이렇게 최종적으로 행정구역 코드 별로 쭉 생성하면 된다.
$ tree
├── ctprvn
├── ctprvn.json
├── emd
│   ├── 11110.json
│   ├── 11140.json
│   ├── 11170.json
...생략
│   ├── 48870.json
│   ├── 48880.json
│   ├── 48890.json
│   ├── 50110.json
│   └── 50130.json
├── emd.json
├── sig
│   ├── 11.json
│   ├── 26.json
│   ├── 27.json
│   ├── 28.json
│   ├── 29.json
│   ├── 30.json
│   ├── 31.json
│   ├── 36.json
│   ├── 41.json
│   ├── 42.json
│   ├── 43.json
│   ├── 44.json
│   ├── 45.json
│   ├── 46.json
│   ├── 47.json
│   ├── 48.json
│   └── 50.json
└── sig.json

3 directories, 270 files
이제 실제 맵을 그려보자
GeoJSON 파일이 준비됐으니 이제 맵차트를 그리면 된다. ㅎㅎ
많은 상용/오픈소스 차트 라이브러리들은 Custom GeoJSON 파일을 읽어서 맵차트를 그릴 수 있다. 작업 할때 리서치를 잠깐 했었는데 대표적으로는 아래의 차트 라이브러리들이 가능하다.
- 상용
- 오픈소스
- ECharts - Population Density of HongKong(2011) 예제
- D3, Leaflet
돈만 있다면야 상용 라이브러리 사용도 충분하겠지만 오픈소스로도 구현은 가능하다.
지금이야 D3 공부가 어느 정도 되서 D3가 편하겠지만 만들 당시에는 익숙하지 않아서 바이두에서 만든 ECharts 로 작업을 진행했었다.
얘도 참 물건인 것 같고 잘 만들었다. 제공해 주는 예제도 엄청 많아서 쉽게 적용 가능하다.
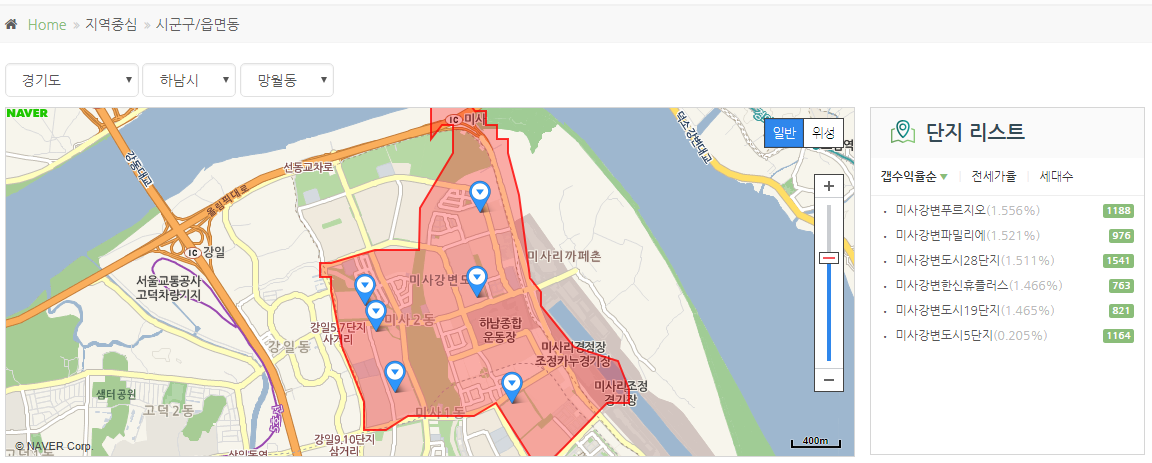
간단하게 갭수익율로 히트맵을 시도/시군구/읍면동 단위로 그릴 수 있고 GeoJSON이 있으니 쉽게 네이버맵 위에도 레이어를 그릴 수 있다.
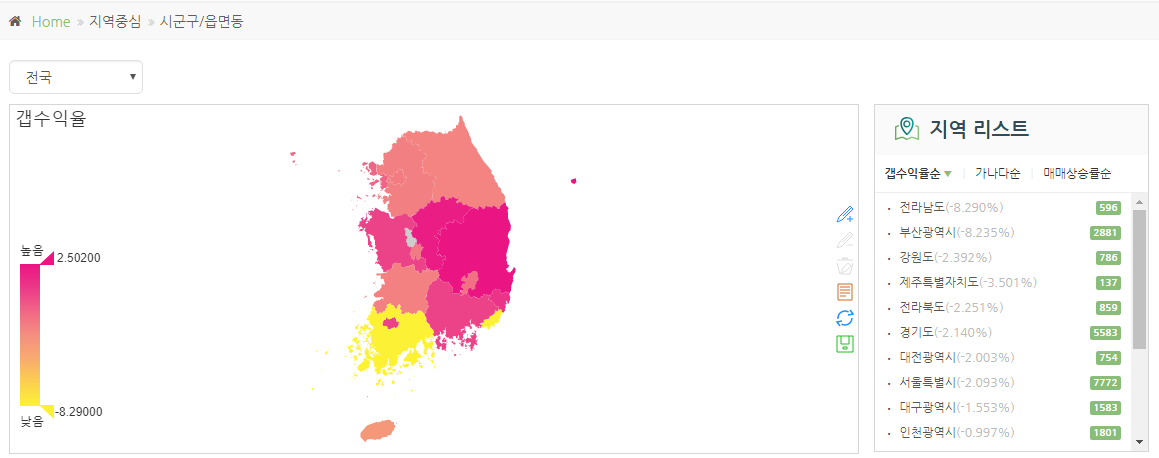
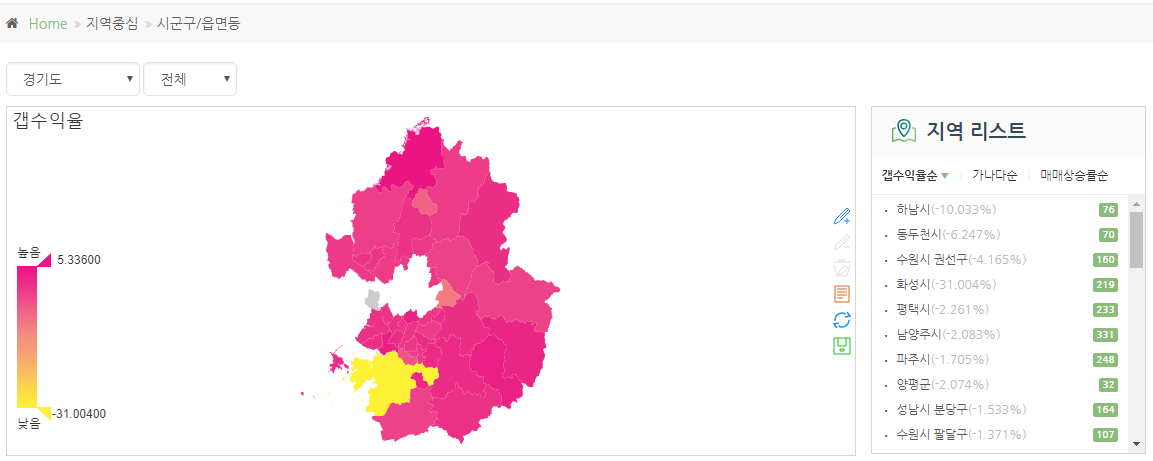
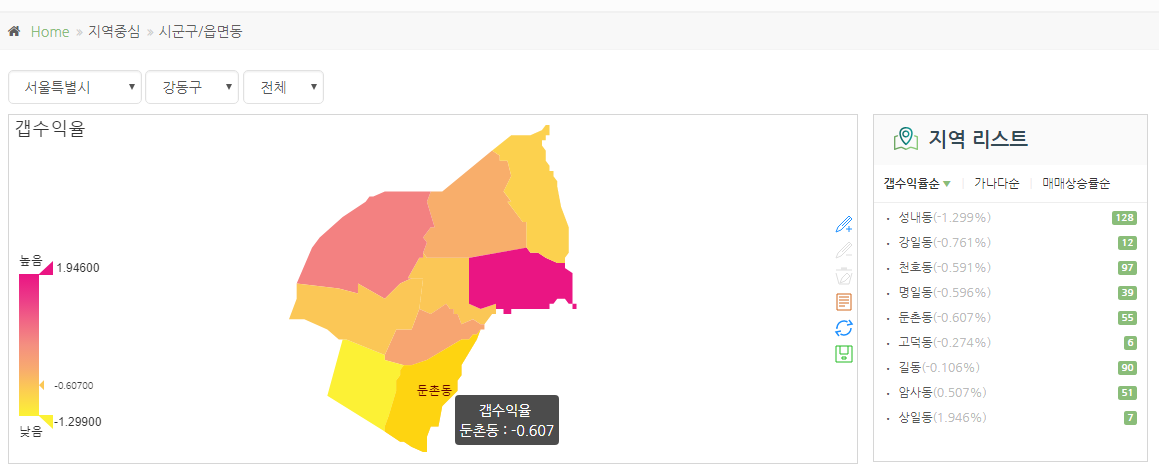
위처럼 원하는 방향데로 히트맵 그리는데는 ECharts 정도로 충분했다.
ECharts를 사용하는 방법은 별도의 설명이 필요 없을 정도로 위에 적어놓은 예제에 자세히 나와있어서 따로 모듈 사용법을 설명할 필요는 없을 것 같고 사용했던 모듈은 참고로 올려둔다.
<script type="text/javascript" src="/static/echarts/echarts.js"></script>
<script type="text/javascript" src="/static/echarts/chart/line.js"></script>
<script type="text/javascript" src="/static/echarts/chart/map.js"></script>
<script type="text/javascript" src="/static/js/region.min.js"></script>
...
<div class="mapview">
  <div id="mapChart" class="feature-box light-gray-bg bordered text-center" style="height:350px;">
  </div>
</div>
...

...
MapChart.drawMapChart('mapChart');
...

---

/**
 * **** 맵 차트 모듈
 * Created by hkwon on 2017-05-12.
 */

// 지역중심 맵 차트 모듈
(function (root, factory) {
  if (typeof define === 'function' && define.amd) {
    define(["jquery", "lodash"], factory);
  } else if (typeof module === 'object' && module.exports) {
    module.exports = factory(require("jquery"), require("lodash"));
  } else {
    root.MapChart = factory(root.$, root._);
  }
}(this, function ($, _) {
  var MapChart = {};

  var version = '1.0';

  //-----
  //--variables
  var type, code;
  var seriesData = [];
  var geo;
  var myChart;
  var ecConfig;

  // ECharts global toolbox option
  var toolboxOption = {
    show: true,
    orient: 'vertical',
    x: 'right',
    y: 'center',
    feature: {
      mark: {
        show: true,
        title: {
          mark: '마킹',
          markUndo: '마킹 원복',
          markClear: '마킹 제거'
        }
      },
      dataView: {
        show: true,
        readOnly: false,
        title: '데이터 보기',
        lang: ['a', 'b', 'c']
      },
      dataZoom: {
        show: false,
        title: {
          dataZoom: '확대',
          dataZoomReset: '줌 취소'
        }
      },
      magicType: {
        show: false,
        title: {
          line: 'line',
          bar: 'bar',
          stack: 'statck',
          tiled: 'tiled',
          force: 'force',
          chord: 'chord',
          pie: 'pie',
          funnel: 'funnel'
        },
        option: {
          // line: {...},
          // bar: {...},
          // stack: {...},
          // tiled: {...},
          // force: {...},
          // chord: {...},
          // pie: {...},
          // funnel: {...}
        },
        type: []
      },
      restore: {
        show: true,
        title: '새로고침'
      },
      saveAsImage: {
        show: true,
        type: 'png',
        title: '이미지로 저장',
        lang: ['저장']
      }
    }
  };

  // ECharts global data range option
  var dataRangeOption = {
    min: 1,
    max: 3,
    text: ['높음', '낮음'],
    realtime: false,
    precision: 1,
    padding: 10,
    calculable: true,
    color: ['#EA1583','#EC3A88','#F16785','#F48F80','#F8AA6F','#FCCF50', '#FCF135']
  };

  // ECharts global data range option
  var tooltipOption = {
    trigger: 'item',
    showDelay: 0,
    transitionDuration: 0.2,
    formatter: function (params) {
      console.log('tooltip ' + params.seriesName);
      var seriesName = params.seriesName ? params.seriesName : '단지 없음';
      return seriesName + '<br/>' + params.name + ' : ' + params.value;
    }
  };

  //-----
  //--utilities function

  var findCodeByName = function (name) {
    var code;

    for (key in geo.features) {
      if (geo.features.hasOwnProperty(key)) {
        if (geo.features[key].properties.name === name) {
          if (type === 'ctprvn') {
            code = geo.features[key].properties.CTPRVN_CD;
          } else if (type === 'sig') {
            code = geo.features[key].properties.SIG_CD;
          } else if (type === 'emd') {
            code = geo.features[key].properties.EMD_CD;
          }
        }
      }
    }

    return (code + "0000000000").slice(0, 10);
  };

  //-----
  //--dom handler

  //-----
  //--event handler
  var addEventHandler = function () {
    // Event 등록
    myChart.on('click', function (params) {
      var name = params.name;

      window.location = '/region/' + findCodeByName(name);
    });
  };

  //-----
  //--private methods
  var loadAndDrawMapChart = function(id) {
    var dataArr = [];

    if (regionJsonDatas) {
      for (var k in regionJsonDatas) {
        var dataObj = {};

        dataObj['name'] = regionJsonDatas[k].lowest_area_nm;
        dataObj['value'] = (regionJsonDatas[k].roi === '-') ? 0 : parseFloat(regionJsonDatas[k].roi);

        dataArr.push(dataObj);
      }

      // data range max,min 계산
      dataRangeOption.max = parseFloat(_.maxBy(dataArr, 'value').value);
      dataRangeOption.min = parseFloat(_.minBy(dataArr, 'value').value);

      console.log('max' + dataRangeOption.max);
      console.log('min' + dataRangeOption.min);
    } else {
      console.log('데이터가 존재하지 않습니다.');

      return false;
    }

    seriesData[0] = {
      name: '****',
      type: 'map',
      roam: true,
      mapType: 'CUSTOM_MAP',
      itemStyle: {
        normal: {label: {show: false}},
        emphasis: {label: {show: true}}
      },
      data: dataArr,
      nameMap: {}
    };

    configureECharts();
    drawEChartsMap(id);
    addEventHandler();
  };

  // Configure ECharts for module loader
  var configureECharts = function () {
    console.log('initializeChart');

    require.config({
      paths: {
        echarts: '/static/echarts'
      }
    });
  };

  // Draw ECharts map
  var drawEChartsMap = function(id) {
    require(
      [
        'echarts',
        'echarts/chart/map',
      ],
      function (ec, theme) {
        // Initialize after dom ready
        myChart = ec.init(document.getElementById(id));

        // code 별 map data load
        require('echarts/util/mapData/params').params.CUSTOM_MAP = {
          getGeoJson: function (callback) {
            $.getJSON('/static/geojson/' + type + '/' + code + '.json', callback)
              .done(function (data) {
                geo = data;
              });
          }
        }

        var option = {
          title : {
              text : '****'
          },
          tooltip : tooltipOption,
          toolbox: toolboxOption,
          dataRange: dataRangeOption,
          series : seriesData
        };

        // Load data into the ECharts instance
        myChart.setOption(option);

        ecConfig = require('echarts/config');
      }
    );
  };

  // uri에 표현된 행정동 code에 따른 type 판별
  // geojson에 기재된 코드 체계로 변환
  var setType = function() {
    var matchType;
    var uri = $(location).attr('pathname');

    var re = new RegExp("\/region\/(.*)");
    var match = uri.match(re);

    if (match[1]) {
      if (match[1].substring(2, 10) === '00000000') {
        code = match[1].substring(0, 2);
        type = 'sig';
      } else if (match[1].substring(5, 10) === '00000') {
        code = match[1].substring(0, 5);
        type = 'emd';
      } else if (match[1].substring(9,10) === '00') {
        type = 'apt';
      }
    } else {
      code = 'ctprvn';
      type = 'ctprvn';
    }
  };

  //-----
  //--public methods

  // 차트 그리기
  MapChart.drawMapChart = function(id) {
    setType();
    loadAndDrawMapChart(id);
  };

  // 맵차트 반환
  MapChart.getChart = function() {
    return myChart;
  }

  return MapChart;
}));
비슷한 기능이 필요하다면 ECharts로도 충분히 원하는 방향으로 그려볼 수 있을 것 같다.
개인적으로 D3에 요새 심취해 있어서 시간이 된다면 D3로 된 예제도 만들어 볼까하는데.. 과연.. 귀차니즘과 시간이 되려나 싶긴하다.
그래도 화이팅~


